With thousands of mutual funds to choose from, finding the right fund can be difficult. A convincing sales pitch can make the decision even harder. However, with the right framework, you can look beyond the sales pitch. This article introduces five questions you can use to assess a fund’s returns, consistency, and risk. The answers provide a starting point for deciding whether the fund belongs in your portfolio.
The five questions
- Did the Fund beat a fair benchmark?
- Was the Fund’s performance consistent, or just a lucky year?
- Did the Fund’s return justify the Fund’s risk?
- How far did the Fund fall when the market turned?
- How long did the Fund take to recover from drawdown?
The first two questions examine a fund’s returns and consistency. The third asks whether those returns justified the risk taken. The fourth and fifth focus on downside risk: how far the fund fell and how long it took to recover. Together, they give you a fuller picture than returns alone.
Now let’s apply these questions to a flexi-cap fund using Deepdive. The goal is not to label the fund “good” or “bad.” Instead, we will show what each question reveals and how you can use the same framework to assess any fund.
Investigation Settings
- Mutual Fund: HDFC Flexi Cap Fund – Direct1
- Data Period: 1 Jan 2020 to 10 July 20262
- Benchmark: Nifty 500 TRI3
Key takeaways
| Question | HDFC Flexi Cap vs Nifty 500 TRI | What does it show? |
|---|---|---|
| Did the fund beat a fair benchmark? | CAGR: 19.7% vs 15.5% IRR: 19.9% vs 14.2%4 | Both the lump-sum investment and SIP beat the benchmark. |
| Was the fund’s performance consistent? | Ahead in 5 of 6 years 59% rolling win rate5 | The fund beat the benchmark in most calendar years and 59% of rolling 3-year periods. |
| Did the extra return justify the extra risk? | Sharpe ratio6: 0.77 vs 0.56 Volatility: ~17% — similar to the benchmark | Volatility was similar, but the higher Sharpe ratio indicates better risk-adjusted returns. |
| How far did the fund fall? | Max drawdown over 6.5 years: -40% vs -38% | The fund fell slightly more than the benchmark during the COVID crash. |
| How long did recovery take? | Days to recover: 256 vs 228 About 1 year for both | Both recovered in about a year. The rapid COVID rebound is not a forecast for future downturns. |
Next, we examine each question in detail using the Deepdive analysis.
Get notified when we publish new fund research or update an existing investigation. Subscribe for Investigation Briefs.
Question 1: Did the fund beat a fair benchmark?
A flexi-cap fund can invest across large-, mid-, and small-cap companies. Under SEBI’s category rules, the Nifty 500 TRI is the benchmark for this category because it covers the same broad range of companies.
We use two metrics:
- CAGR: Shows the annualised growth of a lump-sum investment made at the start.
- IRR: Shows the annualised return on a fixed amount invested at the start of each month.
You can find both metrics in the Deepdive KPI row.
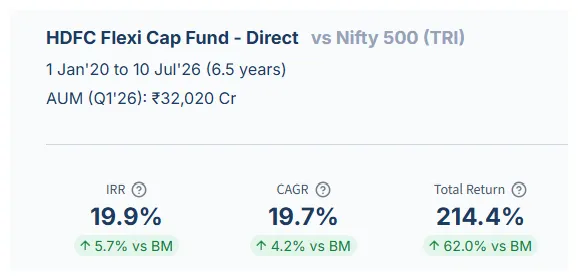
Figure 1: Comparison of the HDFC Flexi Cap Fund’s IRR, CAGR, and total returns against the benchmark.
Assessment: the fund beat the benchmark for both lump-sum and SIP investments
From 1 Jan 2020 to 10 July 2026, the fund outperformed the Nifty 500 TRI on every return measure. CAGR was 19.7% versus 15.5% for the benchmark. IRR was 19.9% versus 14.2%. Total return was 214.4% versus 152.4%.
Question 2: Was the fund’s performance consistent, or did one strong year drive the result?
After comparing returns, the next question is consistency. Did one successful year drive the outperformance, or did it continue across multiple periods? We examine calendar-year returns and rolling 3-year returns for HDFC Flexi Cap Fund – Direct and the Nifty 500 TRI.
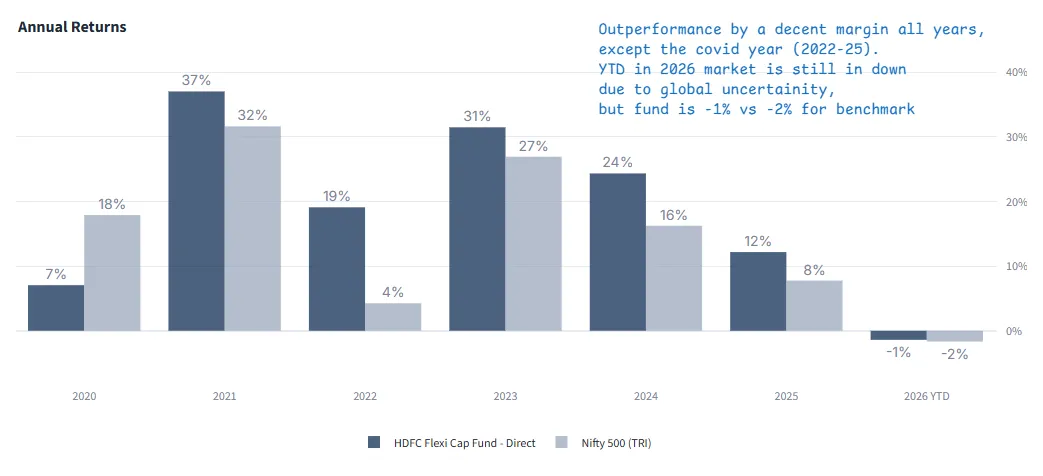
Figure 2: Calendar-year returns for the HDFC Flexi Cap Fund and the Nifty 500 TRI benchmark.
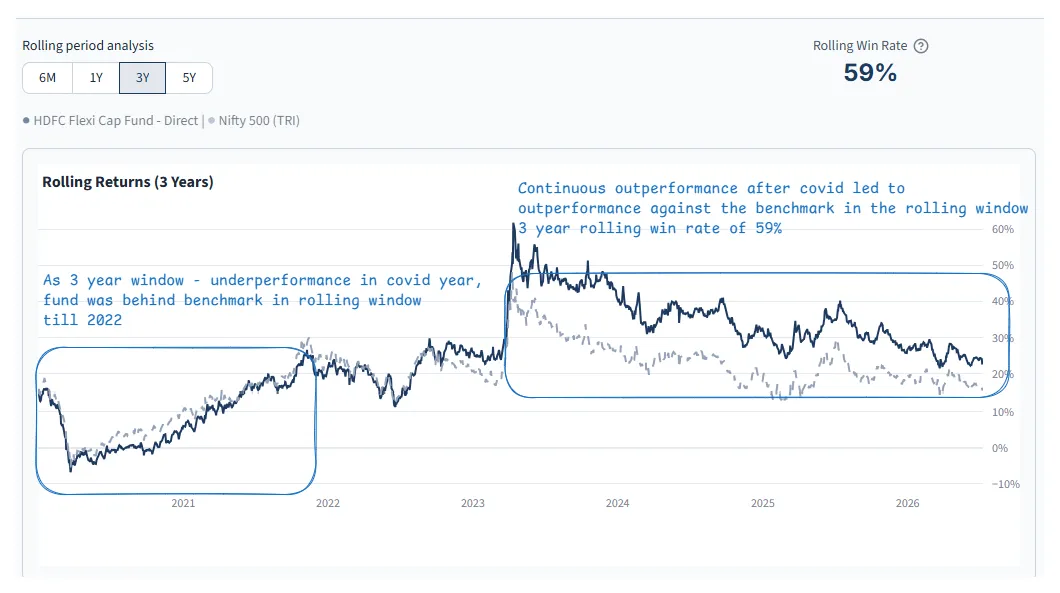
Figure 3: Rolling 3-year returns for the HDFC Flexi Cap Fund and the Nifty 500 TRI benchmark.
Assessment: the fund trailed in 2020, then outperformed
HDFC Flexi Cap – Direct trailed the Nifty 500 TRI in 2020, the COVID-19 year (7% vs. 18%). It outperformed the benchmark in every subsequent year through 2026 year to date.
The rolling 3-year returns tell a similar story. The fund initially trailed because of its weak 2020 start. As that year dropped out of the rolling calculation, the fund moved ahead. Its rolling win rate was 59%, meaning it beat the benchmark in 59% of rolling 3-year periods.
Question 3: Did the extra return justify the extra risk?
Beating an index means less if a fund takes much more risk to do it. We examine two measures:
- Volatility: Shows how much returns move up and down. Lower volatility means the fund’s returns are more stable.
- Sharpe ratio: Compares a fund’s return above the risk-free rate with its volatility. A higher number means more return for the same amount of risk.
You can find both metrics in the Deepdive KPI row.
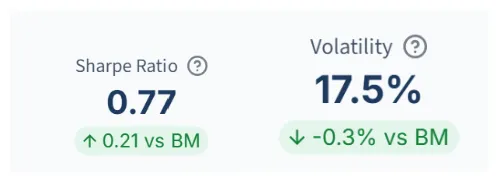
Figure 4: Volatility and Sharpe ratio for the HDFC Flexi Cap Fund and the Nifty 500 TRI benchmark.
Assessment: more return for similar risk
HDFC Flexi Cap – Direct had 17.5% volatility, close to the benchmark’s 17.8%. Its Sharpe ratio was 0.77 versus 0.56 for the benchmark. From 1 Jan 2020 to 10 July 2026, the fund generated more return for a similar level of risk.
Question 4: How far did the fund fall?
First, we examine maximum drawdown: the largest fall from a peak to a low during the period. It shows the loss an investor would have experienced if they bought at the peak and sold at the low. For example, if an investment rises from ₹100 to ₹120 and then falls to ₹96, the drawdown is 20%.
Assessment: the fund fell 40% during COVID
HDFC Flexi Cap – Direct fell 40.2% at the worst point of the period, versus 38.1% for the Nifty 500 TRI. Both reached their lows on 23 March 2020.
Question 5: How long did it take to recover?
Recovery time is how long a fund takes to return to its previous peak after a drawdown. It helps you judge whether a fund’s losses fit your risk tolerance.
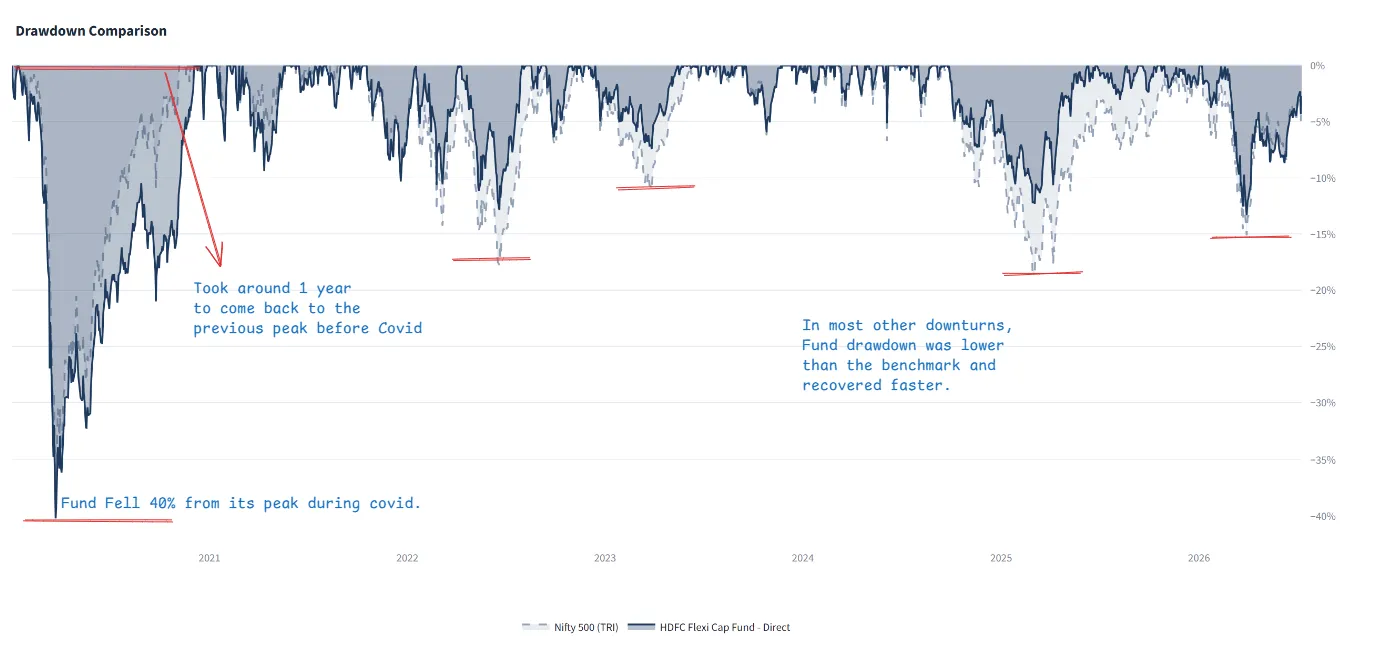
Figure 5: Drawdown and recovery time for the HDFC Flexi Cap Fund and the Nifty 500 TRI benchmark.
Assessment: recovery took about a year
Recovery to the previous peak took 256 days for the fund and 228 days for the benchmark—about a year for both. The rebound after the COVID crash was unusually fast, so do not treat this as a forecast for a future downturn.
In other drawdowns worse than 10%, the fund fell less than the benchmark and recovered slightly faster. Overall, its downside profile was broadly aligned with the benchmark’s.
What these five questions do and do not tell you
These five questions are a starting point for understanding a fund’s returns and risk. They help you judge whether a fund fits your risk appetite and portfolio.
By themselves, they do not explain which holdings produced the result, whether the fund still has the same manager and process, or how its costs compare with its peers. Those topics need separate investigations.
Ultimately, past performance is evidence, not a forecast. Use these questions to look beyond the headline return in a sales pitch and identify what deserves a closer look.
Use the same framework to examine our Parag Parikh Flexi Cap and ICICI Prudential Large Cap investigations.
Notes and sources
Footnotes
-
This worked example uses the Direct plan. AUM is not shown because it changes over time and is not an input to the return or risk calculations. ↩
-
Fund NAV data is from AMFI; Nifty 500 TRI data is from NSE Indices. Calculations are produced in Fund Investigator Deepdive. The end date is the latest common observation available for the fund and benchmark. ↩
-
Nifty 500 TRI is the broad-market reference used for this flexi-cap example. The category rationale is discussed in Question 1. ↩
-
SIP IRR assumes an equal amount invested at the beginning of each month. ↩
-
The rolling win rate is the share of overlapping three-year observations in which the fund’s annualised return exceeded the benchmark’s. ↩
-
Sharpe ratios use a 6.0% annual risk-free rate, applied consistently to the fund and benchmark. ↩
Subscribe for Investigation Briefs
Get notified when we publish new fund research or update an existing investigation.
Disclaimer
This analysis is based on historical performance data, sourced from Fund Investigator's Mutual Fund Deepdive platform. Past performance does not guarantee future results. This report is for informational purposes only and does not constitute investment advice or a recommendation to buy or sell.
Before investing, review the fund's prospectus, consult with a qualified financial advisor, and ensure the investment aligns with your financial goals and risk tolerance. All equity mutual funds carry investment risk, including potential loss of principal.
Fund Investigator is run by an AMFI Registered Mutual Fund Distributor & SIF Distributor (ARN-370951). This report is general information. It is not a recommendation to invest in any fund it describes.