When evaluating mutual funds, numbers tell a story. Here’s what 5 years of data reveals about HDFC Flexi Cap Fund, analyzing risk and SIP returns versus the NIFTY 500 TRI benchmark.
The Numbers That Matter
Over the five-year period from January 2021 to December 2025, HDFC Flexi Cap Fund - Direct delivered a 25.0% CAGR compared to its NIFTY 500 (TRI) benchmark’s 17.1%. In real terms, that’s a 197.2% cumulative return versus the benchmark’s 117.0%—an 80-point difference.
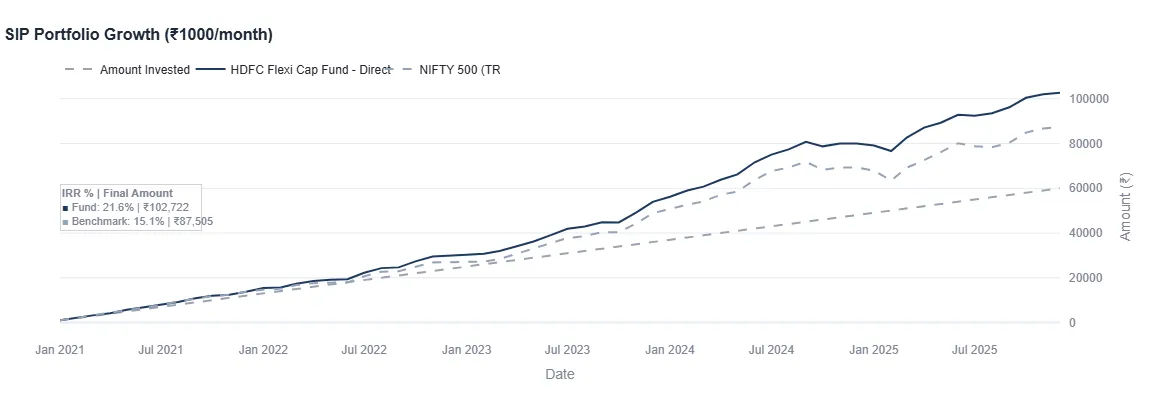
For someone investing ₹1,000 monthly through a SIP, the fund would have grown to ₹102,722 (with 21.6% IRR) versus ₹87,505 in the benchmark. That’s ₹15,000+ more from the same disciplined investment approach.
But here’s where it gets interesting: The fund achieved these higher returns while actually taking less risk. With volatility of 13.4% versus the benchmark’s 14.33%, the fund delivered superior returns with risk.
Risk Management: The Overlooked Story
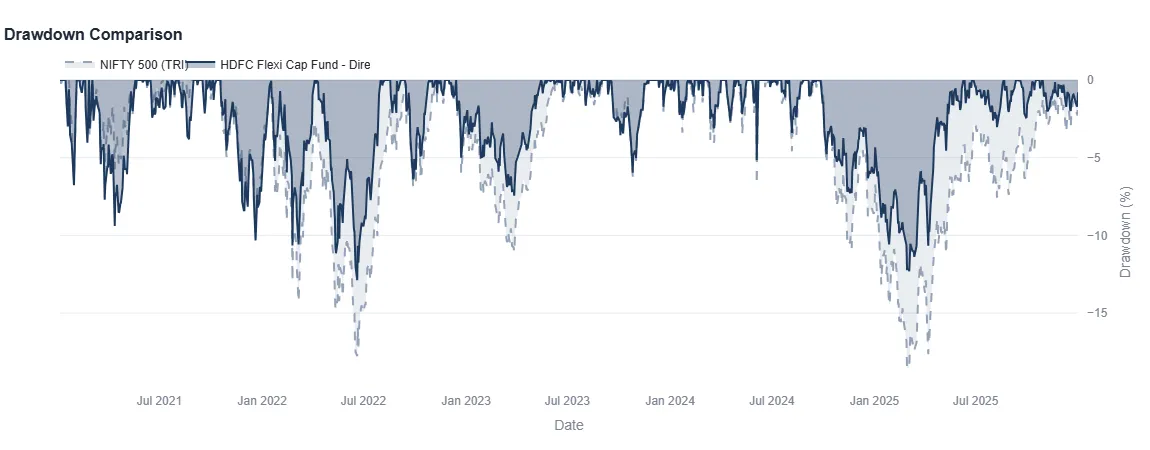
The maximum drawdown tells you about worst-case scenarios. When markets correct, HDFC Flexi Cap bottomed at -12.88%, while the benchmark dropped to -18.59%. That’s a 5.7% cushion during market stress.
More importantly, recovery was swift. The fund bounced back in just 0.17 years (roughly 2 months), while the benchmark remained in drawdown territory. This matters because time out of the market compounds into real opportunity costs.
| Metric | Fund | Benchmark |
|---|---|---|
| Volatility | 13.40% | 14.33% |
| Max Drawdown | -12.88% | -18.59% |
| Sharpe Ratio | 1.55 | 1.00 |
| Positive Years | 5 out of 5 | — |
The Sharpe Ratio of 1.55 (versus 1.00) shows the fund generated 1.55 units of return for every unit of risk—outpacing the benchmark on an efficiency basis.
How Consistent Was the Performance?
Consistency reveals whether outperformance is skill or luck.
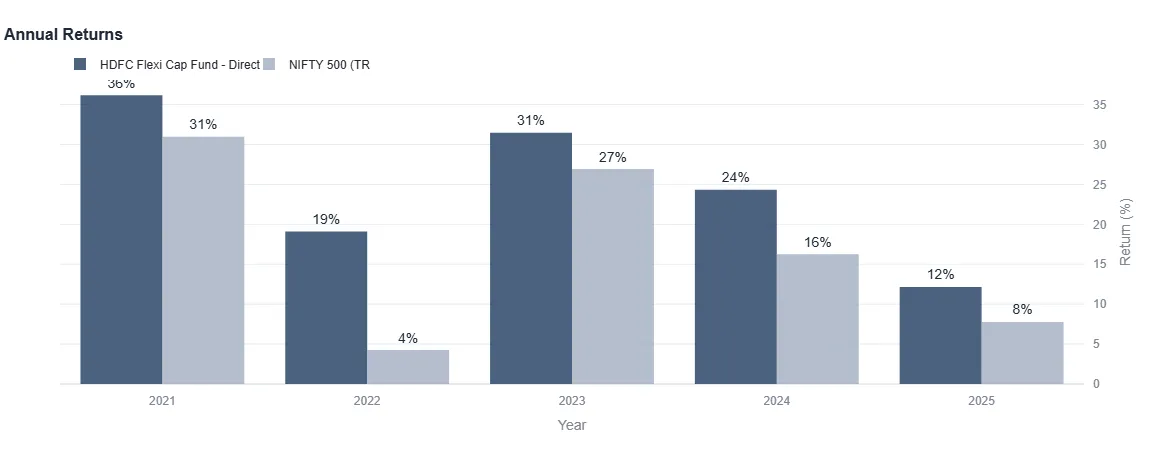
The fund delivered positive returns in all 5 calendar years—no negative years during the analysis period. It also finished ahead of the benchmark in every one of them, but by margins that varied widely: 2021 (+5%), 2022 (+15%), 2023 (+4%), 2024 (+8%), and 2025 (+4%).
The direction was consistent. The size was not. The 2022 margin is larger than 2021, 2023, and 2025 combined, and it came in a year when the benchmark nearly stalled—the NIFTY 500 TRI returned 4% while the fund returned 19%. A single year is doing a disproportionate share of the work in the five-year record, which is worth knowing before treating that record as a steady-state expectation. (This is check 2 of our five-check screen: whether a result is repeated, or carried by one year.)
On a monthly basis, the fund generated positive returns 63.3% of the time. This isn’t about beating the benchmark every month—it’s about maintaining a positive bias while allowing normal volatility.
Understanding the Fund-Benchmark Relationship
With a correlation of 0.9378 and beta of 0.8750, the fund tracks the benchmark direction closely but moves about 12% less. The R² of 0.8794 means the benchmark explains most but not all of the fund’s movements—there’s genuine active management happening underneath.
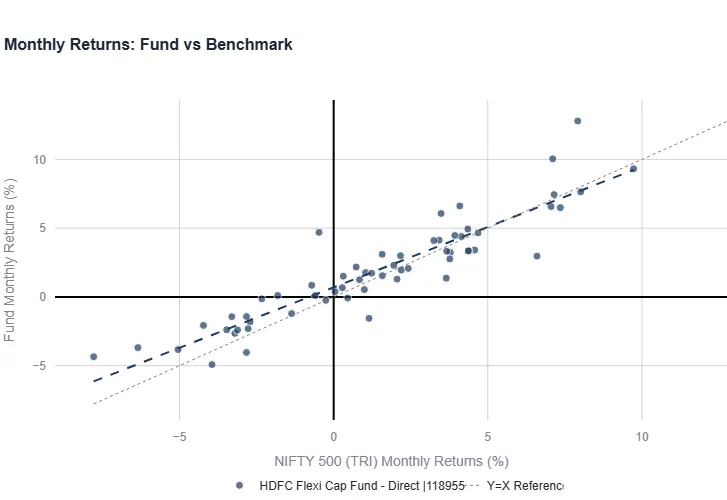
This matters because it shows the fund isn’t simply trying to replicate the benchmark. The active risk of 4.99% represents deliberate portfolio choices—stocks selected and sectors weighted differently—that have translated into measurable outperformance.
What This Actually Means
Higher returns, lower volatility, positive returns every year, and faster recovery from drawdowns. These aren’t theoretical advantages—they compound into real wealth differences over time.
A ₹10 lakh investment at the start of 2021 would have become approximately ₹29.7 lakh in the fund versus ₹21.7 lakh in the benchmark. That’s nearly ₹8 lakh in additional wealth from the same initial capital.
But data is just one part of the story. Your investment goals, time horizon, risk tolerance, and life circumstances matter just as much. A fund that outperformed over these five years doesn’t guarantee future results. Markets evolve, management can change, economic conditions shift.
Subscribe for Investigation Briefs
Get notified when we publish new fund research or update an existing investigation.
Disclaimer
This analysis is based on historical performance data, sourced from Fund Investigator's Mutual Fund Deepdive platform. Past performance does not guarantee future results. This report is for informational purposes only and does not constitute investment advice or a recommendation to buy or sell.
Before investing, review the fund's prospectus, consult with a qualified financial advisor, and ensure the investment aligns with your financial goals and risk tolerance. All equity mutual funds carry investment risk, including potential loss of principal.